Content
- Intro
- Features
- Architecture
- Metrics Principles
- Metrics Format
- Metrics Naming
- Metric Annotations
- Metric Types
- Labels
- Label Types
- Enum Labels
- Info Metrics
- Pushing Metrics
- Exporters
- Service Discovery
- Example Service Discovery Config
- Static Service Discovery
- File System Discovery
- Consul Service Discovery
- EC2 Service Discovery
- Long Term Storage
- PromQL
- PromQL Selectors
- PromQL Matcher Operators
- PromQL Aggregation Operators
- PromQL Rates Operators
- PromQL Time Offsets
- PromQL Query Result Formats
- PromQL Vector Matching
- PromQL Arithmetic Operations over Vectors
- Alerting
- Alerting Config Example
- Metrics Unit Testing
- Resources
Intro
This is an abstract of Prometheus Up and Running book and a few other sources, most listings are taken from them.
Prometheus is an open-source metrics-based monitoring and alerting system originally built at Soundcloud. It uses pulling model to periodically scrap target metrics from an HTTP end-point.
Prometheus designed for operational monitoring, where race conditions and inaccuracies are fact of life, therefore it can't have 100% correct data by design and doesn't aim to it.
Features
- Multi-dementional data model
- Simple metrics format easy to implement.
- Pulls metrics from a target over HTTP.
- Uses autonomous non-clusterizable TSDB.
- Supports service discovery and static configuration.
- Has many clients libraries for popular languages such as python, nodejs, and golang.
- Works from the box as a Grafana data source.
Further Reading:
Architecture
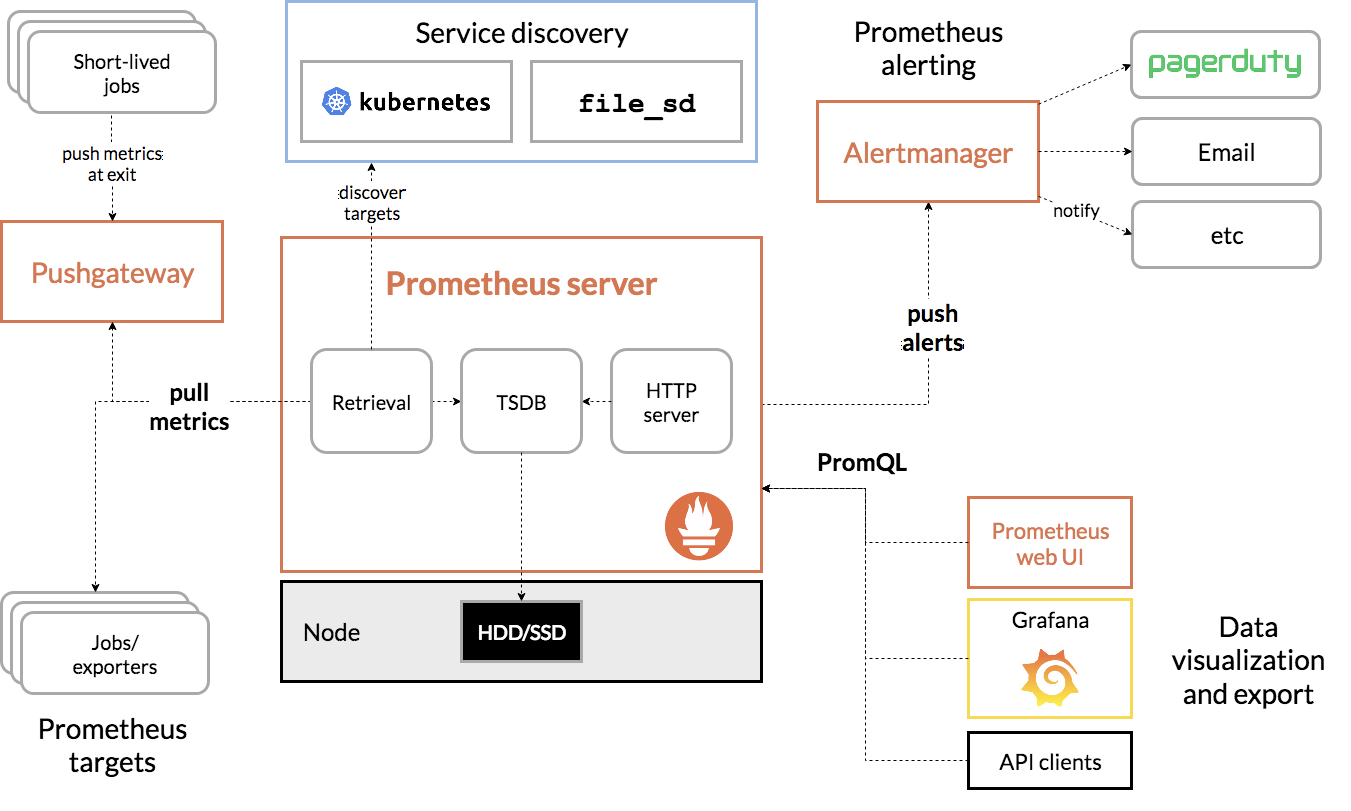
Metrics Principles
- Online Serving Systems usually covered by RED Metrics (Rate, Errors, Duration)
- Offline Serving Systems usually covered by USE Metrics (Utilisation, Saturation, Errors)
Metrics Format
Prometheus scraps metrics in a simple format:
<metric name>{<label name>=<label value>, ...} <value>
For example:
api_http_requests_total{method="POST", handler="/messages"} 20
api_http_requests_totalis a metric namemethodandhandlerare labels used for querying a metric20is a metric value
Metrics Naming
It's a common convention to name metrics snake_case and use reverse domain name notation.
Prometheus has common suffixes convention helps to understand metric types:
_totalis a counter_countis a counter_sumstands for summary_bucketis for a histogram
Further Reading:
Metric Annotations
It's a good practice to annontate metrics by adding TYPE and HELP:
# HELP latency_seconds Latency in seconds.
# TYPE latency_seconds summary
latency_seconds_sum{path="/foo"} 1.0
TYPEhere stands for a metric type.HELPis just a documentation string.
Metric Types
Metric types are usually in the metric # TYPE annotation
-
counterrepresents any value that goes only up (http_request_total, etc). counters are useful to monitor rate of an event, likerps. -
gaugeis similar tosummaryand provides a bucket of metric values. Gauges are useful to observe some metrics can go up and down, like memory allocations (go_memstats_alloc_bytes). -
summaryis similar tohistogram, but don't require pre-defined buckets, that might be useful if you want to use quantiles, but not sure in ranges you need to use. -
histogrammeasures a frequency of an event that falls into specific predefined buckets, like request counts by response status codes (request_duration_seconds_bucket{code="200",entrypoint="traefik"} 38821)
Further Reading:
Labels
Labels are key-value pairs stored in a metric. There is a syntax to add labels:
http_requests_total{path="/login"}
http_requests_total{path="/logout"}
http_requests_total{path="/adduser"}
http_requests_total{path="/comment"}
http_requests_total{path="/view"}
Values specific per label might be queried via PromQL specifically as well as the total value of http_requests_total.
Label names starting with __ (such as __name__) are reserved for internal usage.
Label Types
Labels in prometheus are divided into 2 purposes:
-
Instrumentation labels come from an instrumented application (type of HTTP request, etc).
-
Target labels identify a specific monitoring target, and related more to an architecture and infrastructure. For example, different teams may have different vision of what a "team", "region", or "service" is, so instrumented app shouldn't expose this labels itself rather than leave it to relabeling feature. Labels most likely used as target labels:
env,cluster,service,team,zone, andregion.
Enum Labels
In case you have an enum label values (for a service state, etc), you can create child-metrics for each state and use boolean values on then (0 and 1 to be exact) like below:
# HELP gauge The current state of resources.
# TYPE gauge resource_state
resource_state{resource_state="STARTING",resource="app"} 0
resource_state{resource_state="RUNNING",resource="app"} 1
resource_state{resource_state="STOPPING",resource="app"} 0
resource_state{resource_state="TERMINATED",resource="app"} 0
Info Metrics
Info metrics are specific metric category used to expose target details, such as build numbers, kernel version, etc. There is no sense to use target labels for this purpose, the convention is to use a gauge with a value of 1 for such ones.
Example:
# HELP python_info Python platform information
# TYPE python_info gauge
python_info{implementation="CPython",major="3",minor="5",patchlevel="2",
        version="3.5.2"} 1.0
Generation:
from prometheus_client import Gauge

version_info = {
    "implementation": "CPython",
    "major": "3",
    "minor": "5",
    "patchlevel": "2",
    "version": "3.5.2",
}

INFO = Gauge("my_python_info", "Python platform information",
        labelnames=version_info.keys())
INFO.labels(**version_info).set(1)
Pushing Metrics
By design Prometheus is using the pull model, but in case you need to push metrics to from a short-living targets such as builds and migrations, you can deploy push-gateway to handle them.
Push gateway has a few downsides:
- It might be a bottleneck
- There are no target health-checks
- It's easy to spam with uncontrolled metrics, since prometheus stores any metric forever
There is a simple snippet how to send Tokei data during the main branch build:
#!/bin/bash

POSITIONAL=()
while [[ $# -gt 0 ]]; do
  key="$1"

  case $key in
    --jobName)
      JOB_NAME="$2"
      shift
      shift
      ;;
    --pushgateway)
      PUSHGATEWAY="$2"
      shift
      shift
      ;;
    *)
      POSITIONAL+=("$1")
      shift
      ;;
  esac
done

set -- "${POSITIONAL[@]}"

METRICS=$(tokei . -e node_modules -o json \
|  jq -r 'keys[] as $k | "\($k), \(.[$k] | .code)"' \
| sed 's/,//' | awk '{print "code_"$0}' \
| grep -vi "plain text" \
)

echo "${METRICS}" | curl --data-binary @- "${PUSHGATEWAY}/metrics/job/${JOB_NAME}"```
Further Reading:
Exporters
Exporter gathers metrics from an application and sends them on Prometheus request. Prometheus has planty of exporters:
- Node Exporter provides machine-level metrics such as cpu, memory, and disk usage.
- Blackbox Exporter is useful to take HTTP-probes against some hosts and collect response and resolution timings.
- Puppeteer Assets is to grab some web-page metrics stuff frontenders did.
- Rollbar Exporter if you want to see errors collected by Rollbar in Prometheus
- Lighthouse Metrics another frontend-ish metrics.
- CAdvisor can collect cgroups metrics, such as resources consumption per docker container.
Also many apps such as Traefik and Nginx Ingress export their metrics from the box.
Further Reading:
Service Discovery
Service discovery is a feature to get information about your machines and services from a database they stored in. Prometheus supports many common service discovery mechanisms, such as Kubernetes, EC2, and Consul.
Also prometheus supports metadata mapping in its monitor targets. See: Relabeling.
Example Service Discovery Config
scrape_configs:
 - job_name: example
   consul_sd_configs:
    - server: 'localhost:8500'
   scrape_timeout: 5s
   metrics_path: /admin/metrics
   params:
     foo: [bar]
   scheme: https
   tls_config:
     insecure_skip_verify: true
   basic_auth:
     username: brian
     password: hunter2
Static Service Discovery
Static configuration can be templated with Ansible
# prometheus.yml
scrape_configs:
  - job_name: node
    static_config:
    - targets:
      - host1:9100
    - targets:
      - host2:9100
File System Discovery
File SD uses a list of monitoring targets from the files you provide on the local system. It's useful to integrate SD systems prometheus doesn't support from the box. Files should be json, yaml or yml.
scrape_configs:
 - job_name: file
   file_sd_configs:
    - files:
       - '*.json'
Consul Service Discovery
Consul service discovery integration.
scrape_configs:
 - job_name: consul
   consul_sd_configs:
    - server: 'localhost:8500'
EC2 Service Discovery
EC2 service discovery:
scrape_configs:
 - job_name: ec2
   ec2_sd_configs:
    - region: <region>
      access_key: <access key>
      secret_key: <secret key>
Long Term Storage
Prometheus have read/write API you can write hooks againts, to get its data and work with.
Further Reading:
PromQL
Prometheus has it's own query-language — PromQL.
PromQL Selectors
metric{label=value}[1m] is a selector combined from 2 parts:
metricis a metric name{label=value}is a matcher.[1m]converts a metric into a range
Selectors can have many matchers and logical operators like metric == 0 which returns only case when a metric is equal to zero.
PromQL Matcher Operators
=- equality matcher!=- negative equality matcher=~- regexp matcher!~- negative regexp matcher
Few notes:
- Matchers are fully anchored.
- Regexp matchers smell. If you're using them a lot, for example to match HTTP response codes like
code~="4..", consider to combine this labels into4xxto use with equality matcher `code="4xx" - At least one matcher must not match the empty string, so
{},{foo=""},{foo!=""}, and{foo=~".*"}returns an error.
PromQL Aggregation Operators
sum (metric)returns a sum aggregated by same labels.max (metric)returns max value from a gauge.avg (metric)returns average value for a metric/- the division operator matches the timeseries with the same labels.
There is a without function in case you need to omit specific labels from an aggregation (sum without(label, label)).
PromQL Rates Operators
Rate operators are used against counters to show how fast it's growing up within a sliding window.
For example,rate(metric[5m]) calculates 1 sec averages with a 5m sliding window. rate returns a gauge, so you can apply same aggregations as you do for gauges there.
PromQL Time Offsets
Time offsets allows to get metric value with a given offset, which can be useful to visualize difference with the previous day, week, month, and so on.
For example, metric offset 1h returns a value an hour before the query evaluation time.
PromQL Query Result Formats
Range Vector Instant Vector Scalars Strings
PromQL Vector Matching
Two Instant Vectors are matched by labels one-to-one when you're for example doing division on them.
There are 2 ways to specify set of labels are participating in the matching:
Usage of ignoring operator to specify not related labels:
  sum without(cpu)(rate(node_cpu_seconds_total{mode="idle"}[5m]))
/ ignoring(mode)
  sum without(mode, cpu)(rate(node_cpu_seconds_total[5m]))
Usage of on operator to consider only provided labels:
  sum by(instance, job)(rate(node_cpu_seconds_total{mode="idle"}[5m]))
/ on(instance, job)
  sum by(instance, job)(rate(node_cpu_seconds_total[5m]))
PromQL Arithmetic Operations over Vectors
When you do arithmetic operations over instant vectors, the left-side value is being returned.
An expression below returns all process_open_fds for all instances whose open file descriptors are more then halfway to the maximum:
  process_open_fds
>
  (process_max_fds * .5)
Alerting
Alerts can be configured by same promql you're using for graphing. If you can graph something, you can alert it.
Alertmanager recieves alerts from Prometheus servers and routes them to a proper reciever, such as email, slack or pagerduty. Or you can configure it to silence this alerts.
Alerting Config Example
# prometheus.yml
alerting:
  alertmanagers:
  - static_configs:
    - targets:
       - localhost:9093
# rules.yml
groups:
 - name: example
   rules:
   - alert: InstanceDown
     expr: up == 0
     for: 1m
Further Reading:
Metrics Unit Testing
It's reasonable to have some critical metrics covered by tests. Not all of them (that's probably a fiction), but you might consider to cover transaction logs and some important application logs.
Further Reading:
Resources
There is a list of links and books used in this conspect:
Further Reading:
- Prometheus Cheat Sheet
- Prometheus Documentation
- Prometheus Architecture Explained
- Prometheus Up & Running, Brian Brazil